


Next: Subplot function
Up: Plotting
Previous: Plotting
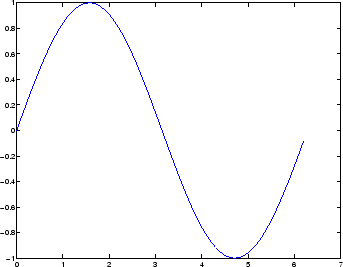
>> t=0:0.1:2*pi;
>> y=sin(t);
>> plot(t,y)
Figure 1:
Sin wave example
 |
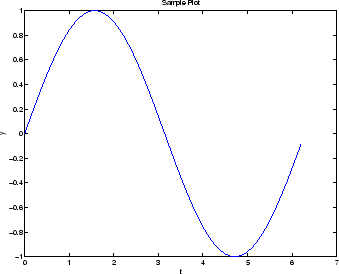
>> xlabel('t')
>> ylabel('y')
>> title('Sample Plot')
Figure 2:
Adding a title to a figure
 |
Copyright © 2004, Aly El-Osery
Last Modified 2005-10-27