Lab 2: Sine Waves and the Oscilloscope
The purpose of this lab is to acquaint you with the operation of your oscilloscope, function generator, and the AC function of your multimeter by investigating the sinusoidal response of simple RC circuits. Sinusoidal waveforms are used because they are constantly encountered in electronics work. Keep your lab notebook up to date as you work. Indicate your reasoning.
1. The Oscilloscope as a Voltmeter
Use the oscilloscope as a voltmeter. Turn on the oscilloscope, display the trace for Channel 1 (trigger on auto or free run, Channel 2 off). Apply 0V then 5V to Ch 1 and compare the measured voltages to a multimeter reading. (Use the cursors to make the oscilloscope measurements accurately.)
2. Sine Waves on the Oscilloscope
a) Apply a low amplitude, 1 kHz sine wave from your function generator to Channel 1. Adjust the trigger controls to get a stable waveform display. Experiment with the trigger level, slope, and other controls. Finish with the display being triggered as the signal crosses zero while rising.
b) Experiment with the time base control. Uncalibrate and calibrate the time base. Adjust the sine wave frequency to be exactly 1 kHz. Use the cursors to measure the period. Switch the cursor function to frequency. Is the reading what you expect? Check the period of ten cycles.
c) Adjust the amplitude of the sine wave to be 1 volt peak-to-peak (p-p). Measure the amplitue of the sine wave using the oscilloscope. What error do you estimate for this amplitude measurement? Measure the amplitude with the AC volts function of the multimeter. How should these numbers compare?
3. Voltage Divider and Superposition
a) Wire up the circuit shown in figure 1 with v1 connected to a 5 volt p-p 1 kHz sine wave. Display v1 on Ch 1. Display the output of this voltage divider, vo , on Ch 2. Compare the voltages and phases. Repeat at 10 kHz.

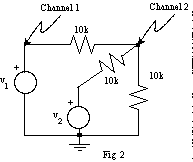
b) Add the resistor and source shown in figure 2 to the above circuit. Connect v2 to 5 volts DC. Using superposition calculate the value of vo. Using the oscilloscope input select control, ground each input to see where 0 volts DC is on the scope. Adjust the trace positions so that 0 volts lies on the center graticule. Is vo what you calculated it to be? Connect v2 to ground instead of 5V, and record how the vo waveform changes. Reconnect v2 to 5V and record the average value of vo as you slowly decrease v1 to 0. Return v1 to a 5V p-p sine wave and a.c. couple the scope inputs. Notice that the d.c. level is removed when the scope input is a.c. coupled. This is because a capacitor has been connected in series with the input.

4. Phase Measurements
a) Connect a 1kHz 5V p-p sine wave to the RC circuit shown in figure 3. Observe the input and output on the two channels. Compare their amplitudes and phases. Measure R with an ohmmeter, and calculate C from the ratio of amplitudes and from the phase shift (see appendix). Compare your calculated values of C with the value labeled on the capacitor. Repeat at several frequencies including 10kHz and 100Hz. What is the best frequency to measure C using this technique? What is the maximum phase shift you can get?

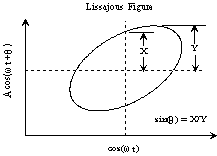
b) Use the X-Y mode of the oscilloscope to display a Lissajous figure. Determine the phase angle between vin and vout from this display.
5. Summary
Before you go, make sure you understand the following concepts about the oscilloscope:
If the RC circuit used in this laboratory has an input voltage given by:
 where
where

Then the voltage across the capacitor will be:

 where
where 


