NO ANSWERS ARE COMPLETE WITHOUT THE UNITS! AS ALWAYS, SHOW
YOUR WORK!

Circuit for prelab exercises
NO ANSWERS ARE COMPLETE WITHOUT THE UNITS! AS ALWAYS, SHOW
YOUR WORK!

Circuit for prelab exercises
For parts 1, 2, and 3, assume the switch has been in position 1 for a long time. At t = 0s, the switch moves to position 2 and the capacitor begins to charge.
For part 4, assume the switch has been in position 2 for a long time. At t = 0s, the switch moves to position 1 and the capacitor begins to discharge.

Figure 1
Unlike in last week's simulation, the voltage source you will use today will be a 0 to 5v pulse signal (Vpulse). The purpose of the pulse is to model a switch opening and closing. When the pulse is low (0 volts), the switch is modeled as open and when the pulse is high (5 volts), the switch is modeled as closed. You will need to define the parameters of the pulse. For the purpose of this exercise, you will inject a waveform that is 5 volts for the first 500 ns and 0 volts for the next 500 ns. To accomplish this, double click on the Vpulse symbol and enter the following attributes: V1 = 0V, V2 = 5V, TD = 0, TR = 0, TF = 0, PW = 0.5us, and PER = 1us. (TR = risetime, TF = falltime, TD = delay time, PW = pulse width, and PER = period of waveform)
Notice there are two voltage level markers on the schematic. These are used in the probe feature of PSPICE. Probe allows the user to observe how a circuit affects a signal. Specifically, you will observe how a 5 volt source charges the capacitor in an RC network (and how the capacitor discharges in the same network). Place the voltage markers on your schematic--one to measure the source voltage and one to measure the capacitor voltage (under the Markers menu, choose Mark Voltage/Level).
Before you simulate this circuit, make sure your analysis setup is correct. Under the Analysis menu, go to Setup and check to see that the Bias Point Detail and Transient options are enabled.
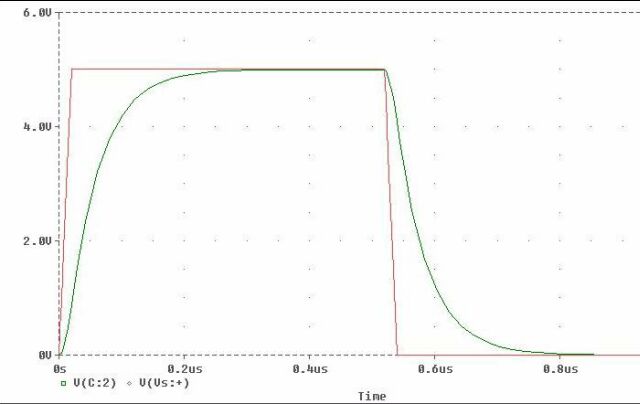
Perform an Electrical Rule Check and Simulate your circuit (Analysis: Simulate). After a bit, the MicroSim Probe window will appear. It should look like this (Figure 2).

Figure 2
Notice that while the pulse reads 5 volts from 0 s to 500 ns, the capacitor is shown to be charging, while during the low portion of the pulse wave (500 ns to 1 us) the capacitor is discharging.
Add a set of cursors to the probe output (Tools - Cursor - Display).
Click the right mouse button to display one set of vertical crosshairs.
To make these crosshairs stick to the capacitor voltage curve, go down
to the curve label (V(C:2)) and use the same mouse button to click on the
small diamond to the left of the label. In the same way, but using the
left mouse button, add the second cursor. This time, click on the diamond
with the left mouse button to make the cursor stick to the charging curve.

Figure 3
We also want to look at a shorter period of time for this plot because the time constant is shorter than the first circuit. Go to Analysis:Setup, select "transient" and click the transient button to adjust the run time of the simulation. Change the "Final Time" to 500ns. This will increase our accuracy when picking points on the plot.
Place voltage level markers at the appropriate nodes to measure the input pulse and the voltage across the equivalent capacitance. Under the Draw menu, use Text to place your name in your circuit. Save your drawing, print out a copy (make it small enough to fit nicely in your lab book!), and tape it into your lab book.
Like before, determine the time constant for this circuit by using the
10% to 90% risetime method. Print out a copy of your plot that shows the
cursors in the 10% and 90% of total voltage amplitude positions. On this
plot, add a label with the time constant information and your name. Tape
the printout into your lab book.
Observe how the change in voltage corresponds to a change in current. (Don't be too preoccupied with the current portion that corresponds to the rise time of the voltage source.) Contemplate the reason for this relationship and explain why it looks like this. If you have had calculus, knowing that current is the derivative of voltage will be helpful in your analysis. How does change in voltage effect change in current? Why? Why is current changing signs as the capacitor alternates between charging and discharging (explain in terms of what is going on in the circuit, and in the mathematics if you know calculus). Print a copy of the plot and put it in your lab book. Since the voltage is difficult to read at this scale, it might be useful to compare this current printout with your previous voltage printout.
© 2007, New Mexico Tech