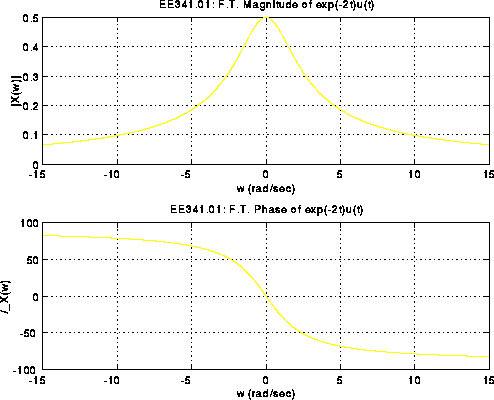
This example shows a MATLAB M-file for plotting the amplitude and phase spectrum of the Fourier Transform for exp(-2t)u(t).
MATLAB M-File example9.m:
%
% Filename: example9.m
%
% Description: This M-file plots the amplitude and phase spectrum
%              of exp(-2t)u(t).
%

w = -15:0.01:15;                            % define frequencies
b = 2;                                      % define b
X_w = 1./(j*w + b);                         % compute F.T.

subplot(2,1,1)                              % plot magnitude spectrum
grid
plot(w,abs(X_w))
grid
xlabel('w (rad/sec)')
ylabel('|X(w)|')
title('EE341.01: F.T. Magnitude of exp(-2t)u(t)')

subplot(2,1,2)                              % plot phase spectrum
plot(w,angle(X_w)*180/pi)
grid
xlabel('w (rad/sec)')
ylabel('/_X(w)')
title('EE341.01: F.T. Phase of exp(-2t)u(t)')
MATLAB Plot Generated:
