t = -2.0:0.01:3.0; % define t-values
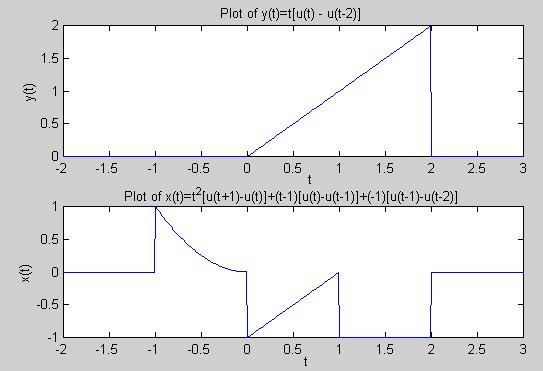
y = t.*((t >= 0) - (t >= 2)); % define y-signal
subplot(2,1,1); % break figure into 2rows, 1col,
% and put next plot in 1st position
plot(t,y); % plot y-signal with labels
xlabel('t');
ylabel('y(t)');
title('Plot of y(t)=t[u(t) - u(t-2)]');
% define x-signal
x = (t.*t).*((t>=-1)-(t>=0)) + (t-1).*((t>=0)-(t>=1)) + (-1)*((t>=1)-(t>=2));
subplot(2,1,2); % break figure into 2rows, 1col,
% and put next plot in 2nd position
plot(t,x); % plot x-signal with labels
xlabel('t');
ylabel('x(t)');
title('Plot of x(t)=t^2[u(t+1)-u(t)]+(t-1)[u(t)-u(t-1)]+(-1)[u(t-1)-u(t-2)]');
MATLAB Plot Generated: