% Filename:  example12.m
%
% Description:  M-file demonstrating the use of the dft()
%               function for computing the DFT of a
%               discrete-time signal.
%

figure(1); clf;                 % open and clear figure 1
clear;                          % clear matlab memory

f = [2 -2 1 -1];                % DT signal f[k]
Fr = dft(f)                     % compute DFT F_r of f[k]
No = length(Fr);                % number of points in F_r
r = 0:No-1;                     % frequency sample numbers

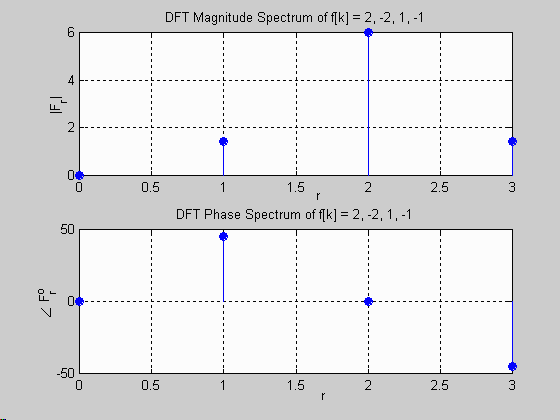
subplot(2,1,1);                 % plot DFT magnitude spectra
stem(r,abs(Fr),'filled'); grid;
xlabel('r'); ylabel('|F_r|');
title('DFT Magnitude Spectrum of f[k] = 2, -2, 1, -1');

subplot(2,1,2);                 % plot DFT phase spectra
stem(r,angle(Fr)*180/pi,'filled'); grid;
xlabel('r'); ylabel('\angle F_r^o');
title('DFT Phase Spectrum of f[k] = 2, -2, 1, -1');
MATLAB Response Generated:
Fr =

        0
   1.0000 + 1.0000i
   6.0000 + 0.0000i
   1.0000 - 1.0000i
MATLAB Plot Generated:
