%
% Filename: example2.m
%
% Description: M-file for demonstrating periodicity of discrete-
%              time signals.
%

clear; clf;                    % clear memory and figure

k = 0:20;
x = sin(5*k + 0.1);
subplot(2,2,1);
stem(k,x,'filled'); grid;
xlabel('k'); ylabel('x[k]=sin(5k+0.1)');
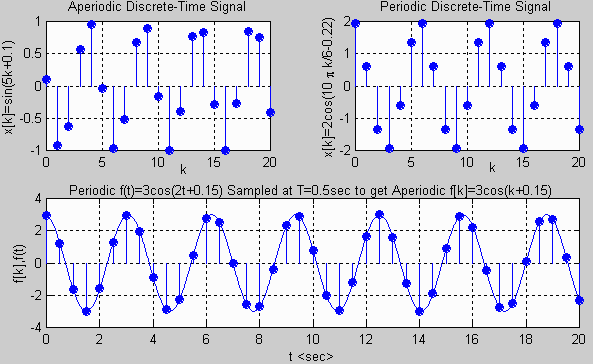
title('Aperiodic Discrete-Time Signal');

x = 2*cos(10*pi*k/6 - 0.22);
subplot(2,2,2);
stem(k,x,'filled'); grid;
xlabel('k'); ylabel('x[k]=2cos(10 \pi k/6-0.22)');
title('Periodic Discrete-Time Signal');

t = 0:0.01:20;                 % continuous-time values
fct = 3*cos(2*t+0.15);         % continuous-time signal
T = 0.5;                       % sample interval (time)
k = 0/T:20/T;                  % discrete-time values (from t=kT)
fdt = 3*cos(k+0.15);           % discrete-time signal
subplot(2,1,2);                % plot both signals on continous-time axis
plot(t,fct);                   % use t = kT for discrete-time signal
hold on;
stem(k*T, fdt, 'filled');
hold off;
grid;
xlabel('t '); ylabel('f[k],f(t)');
title('Periodic f(t)=3cos(2t+0.15) Sampled at T=0.5sec to get Aperiodic f[k]=3cos(k+0.15)');
MATLAB Plot Generated:
