%
% Filename: example8.m
%
% Description: M-file to plot discrete-time signals and their DTFT.
%
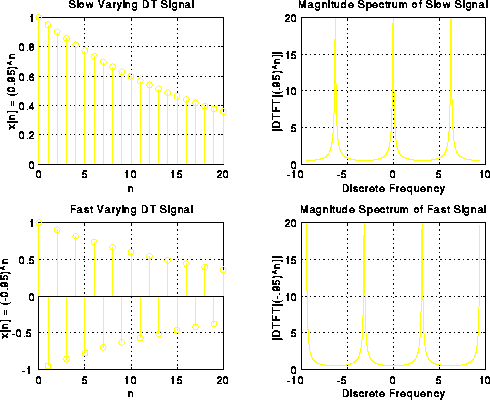
n = 0:20; % define DT variable
xfast = (-0.95).^n; % define DT signals
xslow = (0.95).^n;
subplot(2,2,1); % plot slow signal
stem(n,xslow);
grid;
xlabel('n');
ylabel('x[n] = (0.95)^n');
title('Slow Varying DT Signal');
subplot(2,2,3); % plot fast signal
stem(n,xfast);
grid;
xlabel('n');
ylabel('x[n] = (-0.95)^n');
title('Fast Varying DT Signal');
W = -3*pi:0.01:3*pi; % define DT frequencies
Xfast = 1./(1+(0.95)*exp(-j*W)); % define DTFT of signals
Xslow = 1./(1-(0.95)*exp(-j*W));
subplot(2,2,2); % plot DTFT of slow signal
plot(W,abs(Xslow));
grid;
xlabel('Discrete Frequency');
ylabel('|DTFT[(.95)^n]|');
title('Magnitude Spectrum of Slow Signal');
subplot(2,2,4); % plot DTFT of fast signal
plot(W,abs(Xfast));
grid;
xlabel('Discrete Frequency');
ylabel('|DTFT[(-.95)^n]|');
title('Magnitude Spectrum of Fast Signal');
MATLAB Plot Generated: