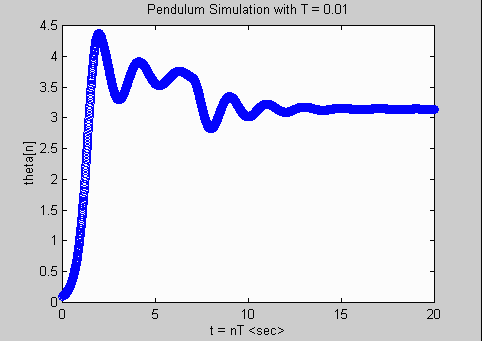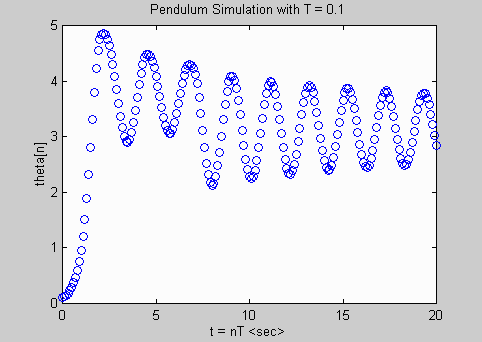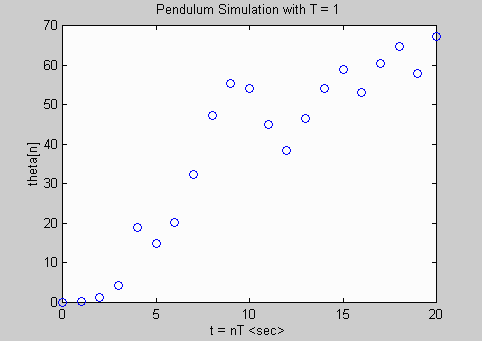


%
% Filename: example5.m
%
% Description: M-file for simulating pendulum using difference
%              equation obtained from nonlinear model.
%

clear;                          % clear memory

m = 1; B = 1; L = 1; g = 10;    % define pendulum parameters
theta_init = 0.1;               % initial position
theta_dot_init = 0.2;           % initial velocity

T = [0.01 0.1 1.0];             % vector of sample intervals
                                % to be used

for k=1:3,                      % run simulation three times for
                                % different sample intervals

  tfinal = 20;                  % simulation time
  N = tfinal/T(k);              % number of samples to simulate over

  theta_prev1 = T(k)*theta_dot_init + theta_init; % IC theta[1] for recursion
  theta_prev2 = theta_init;                       % IC theta[0] for recursion

  nvec(1) = 0; nvec(2) = 1;     % load ICs into vectors for plotting
  thetavec(1) = theta_prev2;    % since loop starts at n = 2
  thetavec(2) = theta_prev1;

  for n = 2:N,                  % enter recursion loop

    if((n >= (2+2/T(k))) & (n < (2+7/T(k)))), % define input torque
      torque_prev2 = 5;
    else
      torque_prev2 = 0;
    end

    theta = (1/(m*L*L))*((2*m*L*L-B*T(k))*theta_prev1 + ...
                         (B*T(k)-m*L*L)*theta_prev2 + ...
                         m*g*L*T(k)*T(k)*sin(theta_prev2) + ...
                         T(k)*T(k)*torque_prev2);
    theta_prev2 = theta_prev1;  % store previous values for next
    theta_prev1 = theta;        % iteration

    nvec(n+1) = n;
    thetavec(n+1) = theta;

  end;

  figure(k);                    % plot resulting response
  plot(nvec*T(k),thetavec,'o');
  xlabel('t = nT ');
  ylabel('theta[n]');
  ttlevec=['Pendulum Simulation with T = ', num2str(T(k))];
  title(ttlevec);

  nvec = 0; thetavec = 0;       % reset/clear vectors

end;
MATLAB Plots Generated:


